If you’re an online gamer, YouTube game streamer, Bitcoin miner, and graphics designer, you must know how to check GPU health to keep running your gig smoothly.
Various hardware of your performance computer or laptop needs frequent testing. It ensures that all the hardware parts are working at their optimum levels. Hence, just like the CPU, RAM, power unit (PSU), and monitor, you also need to regularly check GPU health.
But how do you check GPU health at home? It’s quite easier than you think if you read the article until the end.
Why Do You Need a GPU Health Check?
- You’re planning to buy a used GPU to save some cash. You must take it through some testing before finalizing the deal.
- You don’t work any system issues during live streaming a video game or working on vital design projects.
- Find out the status of the GPU so that you can buy a replacement just before the hardware failure.
How to Check GPU Health Using Task Manager
The Windows Task Manager tool of Windows 10 and Windows 11 operating systems can help you in checking GPU health. Follow these steps to access the GPU performance view of the Windows Task Manager tool:
- Press Ctrl+Shift+Esc to launch the Task Manager tool.
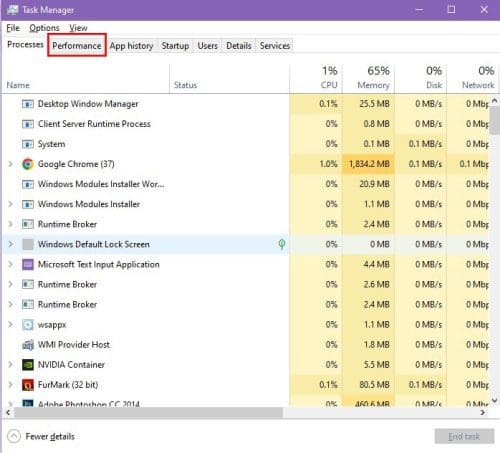
- Select the Performance tab.
- Click GPU on the left-side panel.
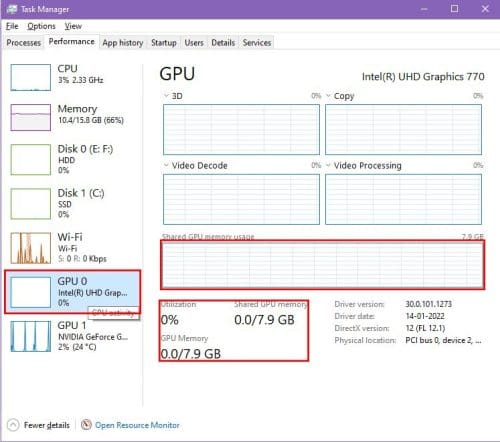
- If you’ve got more than one GPU, choose the one that’s in use.
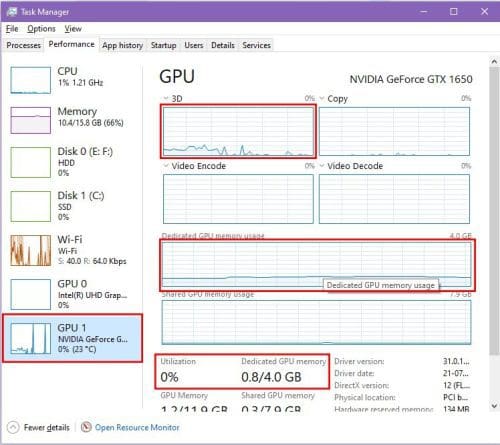
- The idle one won’t show any real-time data. On the contrary, the active GPU will show live charts and graphs. This is how you can determine which one is the active GPU.
Focus on the following data parameters on a live chart of an active GPU:
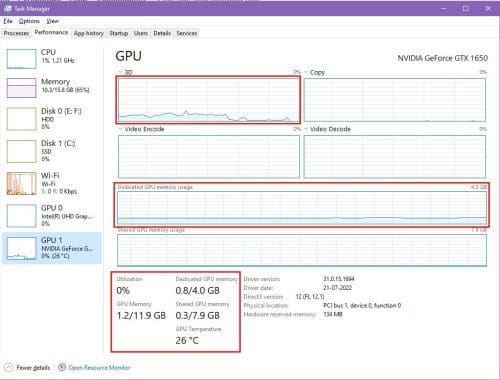
- The tool shows the Driver version, Driver date, DirectX version, and Physical location appropriately. When data for the above parameters are missing or incorrect, this is an indication of a faulty GPU.
- GPU Temperature stays within the room temperature or a few degrees above or below the room temperature in the resting state. It’s the state when you’re not running any game or graphic designing tool that uses the GPU.
If you see the GPU temperature is 20°C to 25°C more than the room temperature in the resting state, the GPU health check is indicating that the GPU cooling fan might be faulty.
How to Check GPU Health Using DXDIAG Command
DXDIAG is the short form for DirectX Diagnostic Tool. It comes out of the box with Windows operating systems like Windows 7, Windows 10, Windows 11, etc. Only, if you’re using a DirectX-enabled GPU, the command will work.
Follow these steps when checking GPU health using the DXDIAG command:
- Press Windows + R together. The Run tool will open.
- Type dxdiag and hit Enter.
- DirectX Diagnostic Tool will open and load system information in a few seconds.
- Select the Display tab.
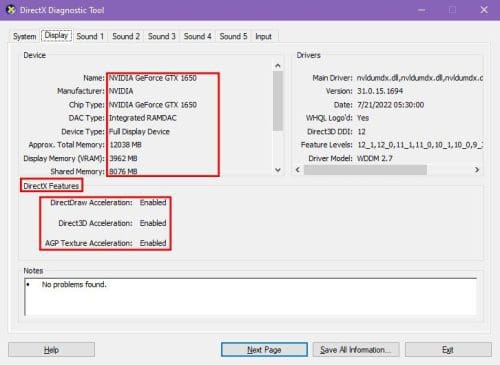
Here’s how to gauge the GPU health from the DirectX Diagnostic Tool:
- Read the information in the Device section. Match the data with the specifications of the GPU supplied on the manufacturer’s manual.
- Review the active features in the DirectX Features section. DirectDraw, Direct3D, and AGP Texture Acceleration should show Enabled. If these properties are empty or the tool shows Not Available, there’s a problem with the GPU driver or hardware.
Update the GPU driver and check back. If the issue isn’t resolved, the hardware is faulty or failing.
How to Check GPU Health From Windows Settings
You can also find out if the GPU health is good or not from the Windows Settings tool. Here’s how:
- Press Windows + I to open Windows Settings.
- Select System and then click Display.
- Scroll down to find Advanced display settings on the right-side panel. Click on it.
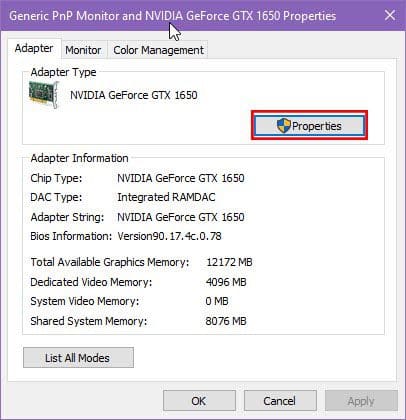
- Now, select Display adapter properties and then click Properties.
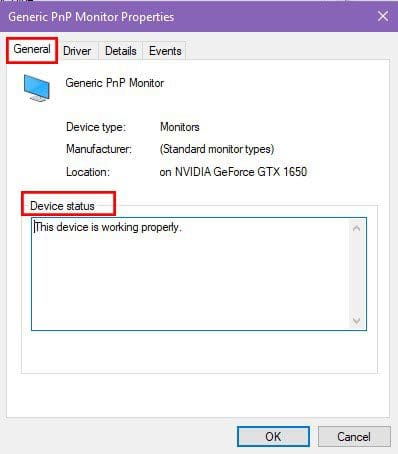
- Check the Device status message.
If the Device status text shows “This device is working properly,” then the GPU is in good health. However, if the status shows any warning or error codes, then the GPU must be suffering from hardware or software faults.
So far, the above GPU health check methods give you a qualitative health status of the GPU. To know actual figures, you can use a benchmarking tool as mentioned below.
How to Check GPU Health Using A Benchmarking Tool
You can get the Geeks3D FurMark GPU benchmarking tool to find out advanced data on your GPU health. The tool is free for download from the official website of Geeks3D. As of now, the tool is only compatible with Windows devices.
Download the app and install it. Once you’ve installed the tool, follow these steps:
- Run the app from the Windows Desktop.

- Click Settings and then set the GPU temperature alarm to 90°C.

- Click Ok to save the temperature alarm.
- Under the GPU Benchmark section, select any preset resolution for benchmarking.
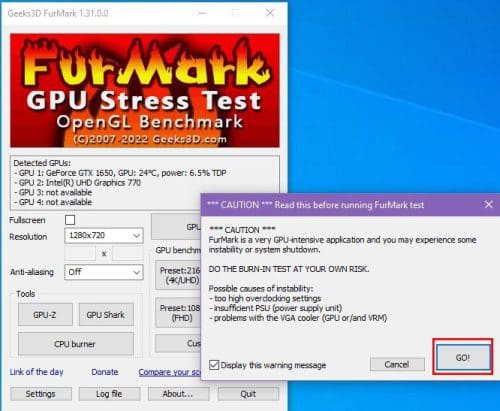
- On the next screen, click Go.
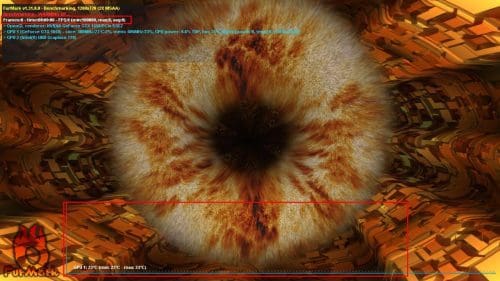
You’ll see a 3D animation for about one minute after you start the GPU benchmarking test. Monitor its performance during the test. Normally, if you see poor frame per second (FPS) values and higher temperatures for the GPU, then its health isn’t good.
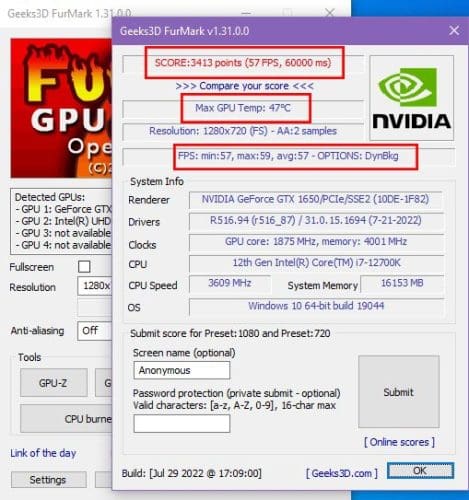
At the end of the testing, the tool will generate a score. You can match the score with similar other test results to find a comparative analysis of your GPU health. You’ll find the comparative chart on FurMark Scores website.
How to Check GPU Health Physically
The final method is inspecting the actual hardware by removing the GPU from your computer. You can only do this on your desktop computer. If you’re experiencing GPU issues in your gaming laptop, contact the manufacturer for technical assistance.
It’s a tricky task but important since you’ll know the physical status of the GPU and clean it too. Once you’ve taken out the GPU from your system, look for the followings:
- The heatsink attached firmly or not
- Cooling fan installed snugly
- Rust or debris on the circuit board
- Thermal paste material coming out in the powdered form
If you notice the above, it’s a good time to order one of the best budget GPUs.
Conclusion
Now you know how to check GPU health using various built-in tools of Windows 10 or Windows 11 computers. You’ve also explored a third-party GPU benchmarking tool for GPU stress tests.
Now, choose the method that you find convenient to perform a GPU health check. Don’t forget to leave a comment if you know of any other methods for checking GPU health.
Next up, build the best Esports PC for your budget effortlessly.